

Hook rate is the share of impressions that turn into a 3-second video play. The formula is 3-second video plays divided by impressions, as a percentage. If a video ad has 10,000 impressions and 2,800 three-second plays, its hook rate is 28%.
It's a useful first check on whether an ad's opening stops the scroll. It isn't a Meta metric, though. It's an industry convention you build yourself in Ads Manager, and people define "good" and its companion, hold rate, in different ways. This guide gives you the formula, the steps to add it, real 2026 benchmark data with its limits and a way to read the result.
The formula
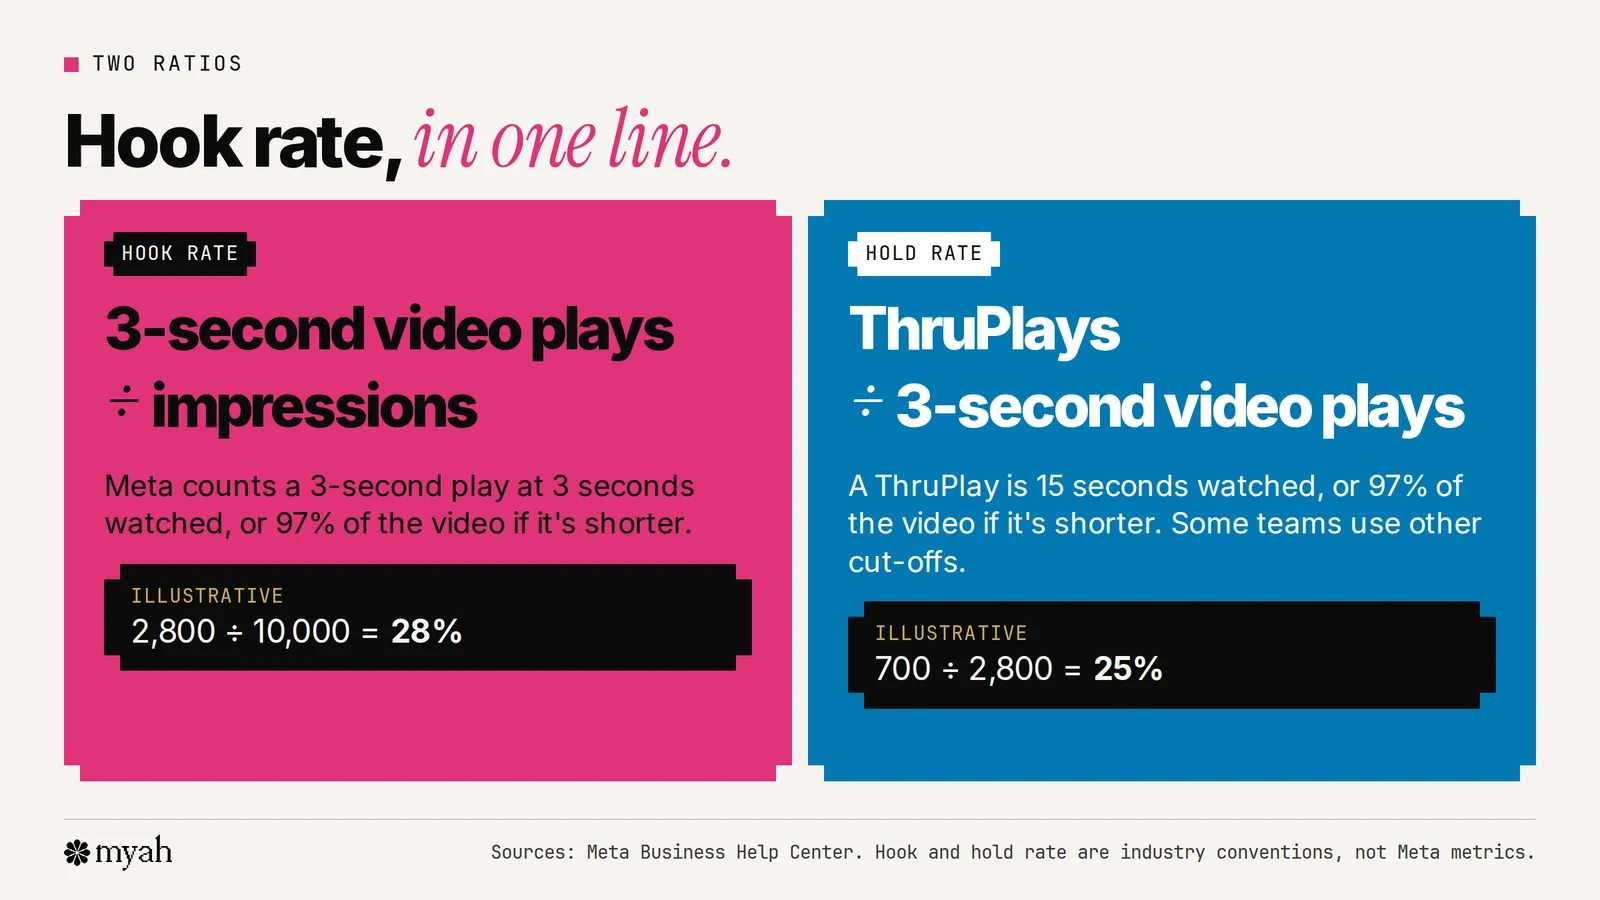
Hook rate = 3-second video plays ÷ impressions × 100
Both parts are Meta metrics, and Meta defines them precisely:
- 3-second video plays counts the number of times your video played for at least 3 seconds, or for 97% of its length if it's shorter than 3 seconds. Time spent replaying the video in a single impression isn't included.
- Impressions are the number of times your ads were on screen. For video, Meta notes that a video isn't required to start playing for an impression to count.
That last point matters. The denominator includes every time the ad appeared, including the ones where someone scrolled past before the video began. So hook rate measures more than whether your first frame is good. It also reflects how quickly the video loads and starts. Meta also says its method of counting video impressions differs from industry standards for video ads, which is one reason to compare ads inside the same account and method rather than against numbers from elsewhere.
Some people call the same ratio "thumbstop rate" or "thumb-stop ratio." It's the same formula.
Hold rate: the companion number
Hook rate tells you how many people stayed for 3 seconds. Hold rate tries to tell you what happened next. The most common version is:
Hold rate = ThruPlays ÷ 3-second video plays × 100
A ThruPlay is Meta's term for a play that reaches a set duration. Meta's About ThruPlay page says the goal is available at 6 seconds or 15 seconds, and that a 15-second ThruPlay counts when someone watches at least 15 seconds, or reaches 97% completion if the video is shorter than 15 seconds.
But "hold rate" has no single definition. Vendor guides use at least three versions: 15-second plays ÷ 3-second plays, ThruPlays ÷ 3-second plays, and 75%-watched plays ÷ 3-second plays. Their benchmarks differ accordingly. One guide puts a healthy 15-second hold rate at 15 to 25%, while another cites Motion's published bands, where 40 to 50% is average, for what it calls Motion's definition. Both are vendor blogs rather than Meta guidance, and the numbers aren't comparable. Decide which version you use, write it down and stick to it.
How to add hook rate in Ads Manager
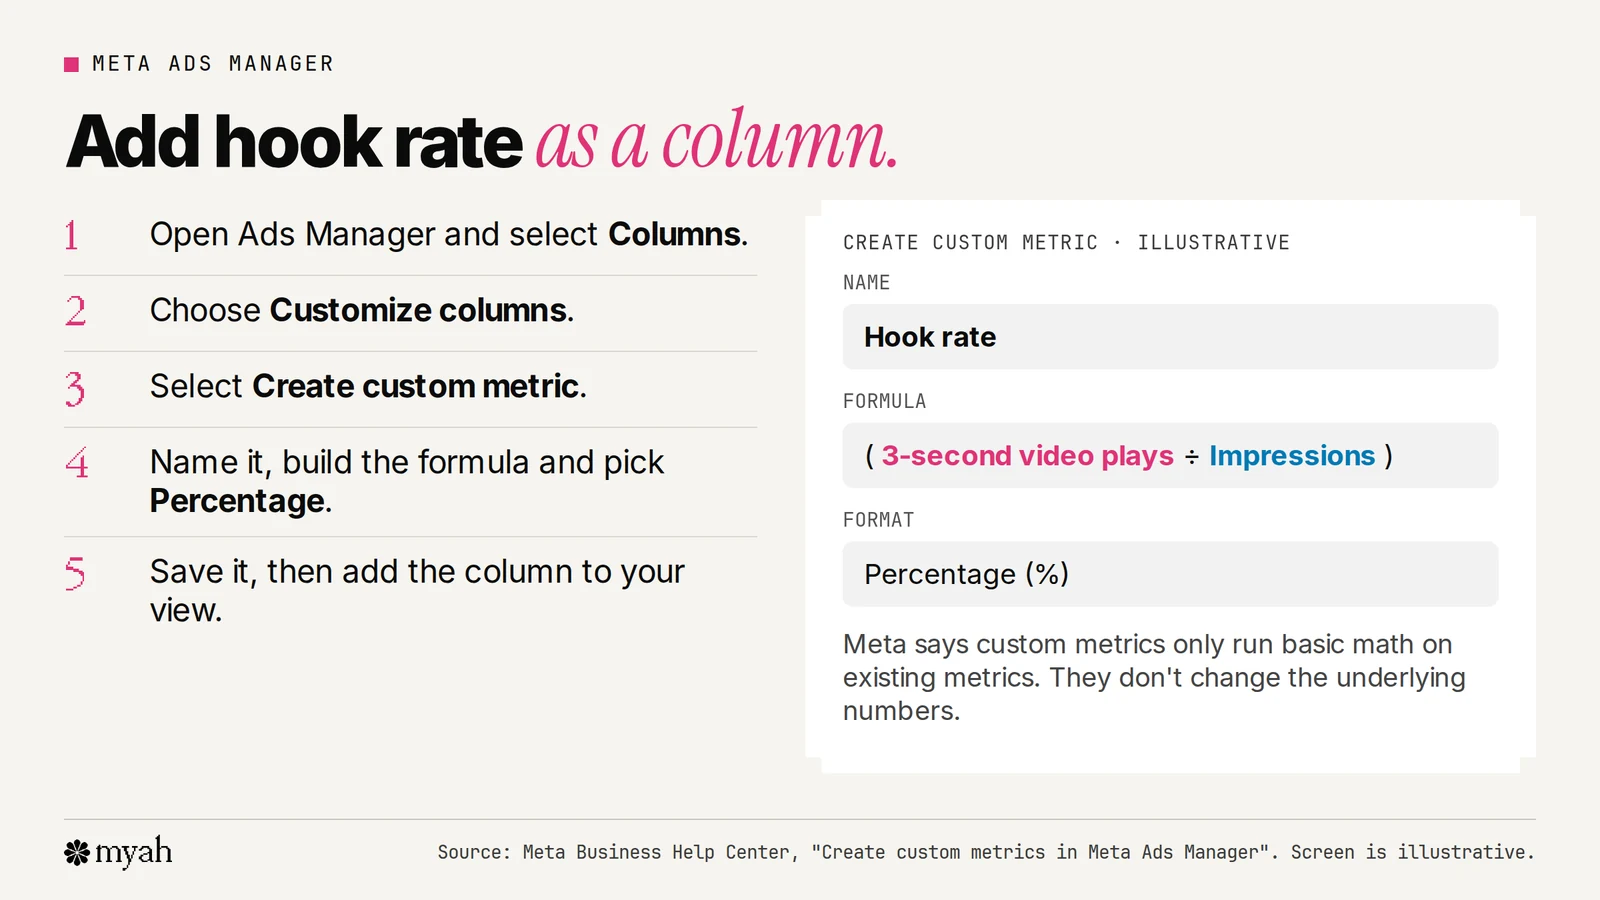
Meta's help page lets you create custom metrics in Ads Manager. The steps:
- Open Ads Manager and select Columns.
- Choose Customize columns.
- Select Create custom metric.
- Fill in the form: select the metrics and the operator for the formula, name the metric, add an optional description and choose a format (numeric, percentage or currency).
- Save it and add the column to your view.
Meta says custom metrics only perform basic mathematical calculations on existing metrics. They don't change the underlying numbers.
Build hook rate as 3-second video plays ÷ impressions, in percentage format, and add hold rate the same way. Use the paid ad columns in Ads Manager rather than organic Insights.
What counts as a good hook rate?
There is no official number. The best available reference is large-sample data, with its limits spelled out.
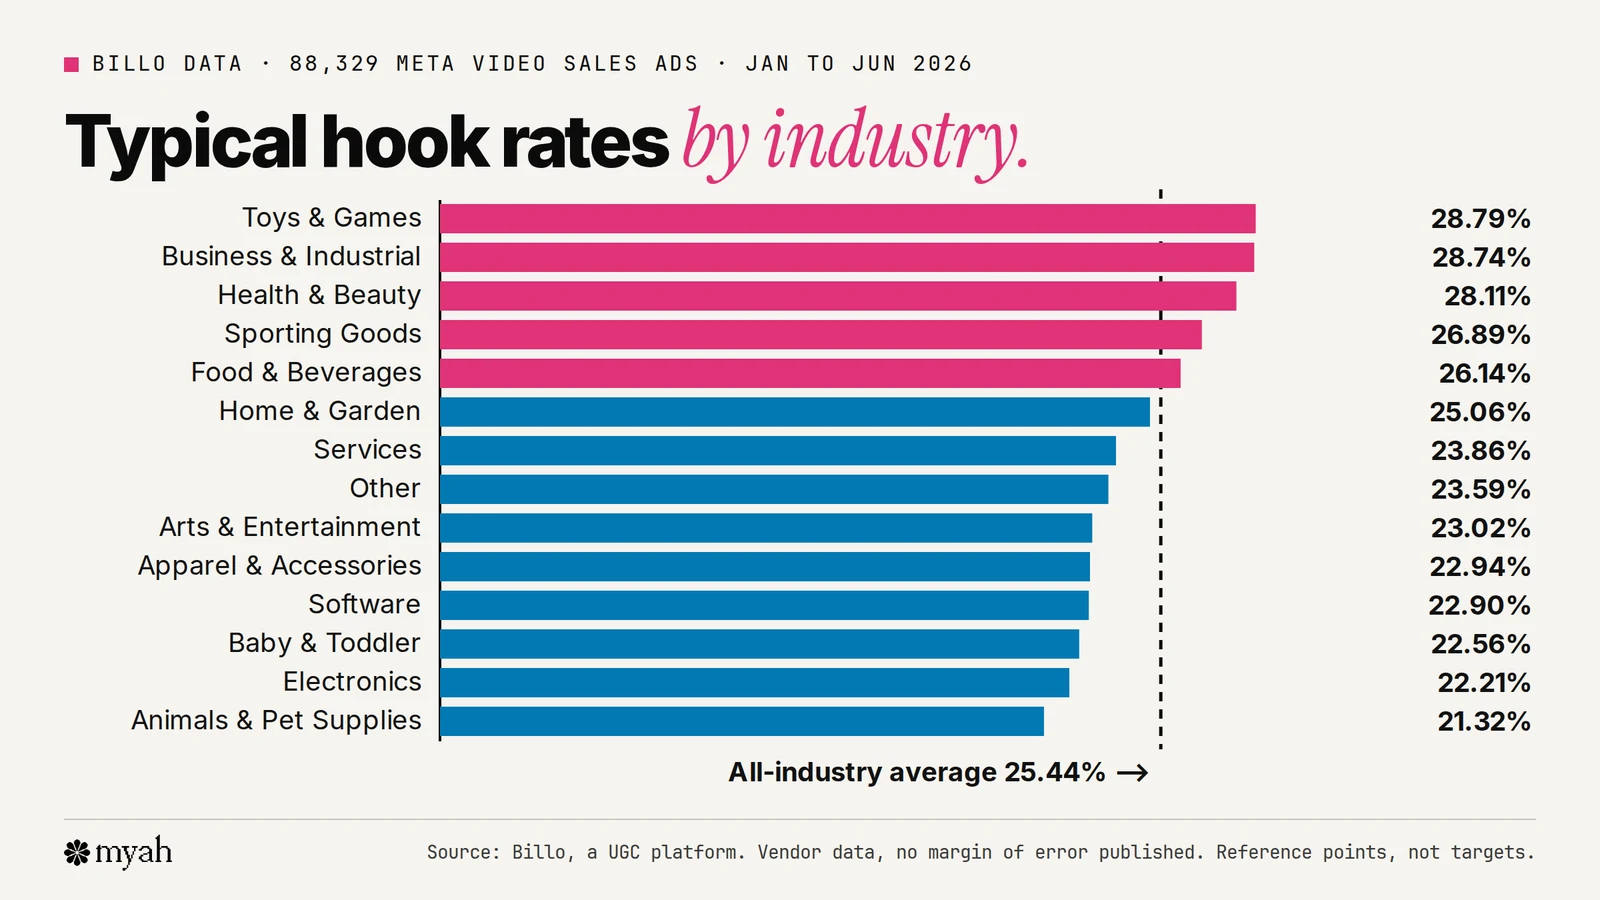
Billo's H1 2026 data. Billo, a UGC marketplace, published an average hook rate of 25.44% across 88,329 sales-objective Meta video ads that ran between January and June 2026, representing $122 million in spend and $212 million in purchase value across 14 industries. That compares with 24.42% in the second half of 2025. Its inclusion rules: video ads with a sales objective, reliable metrics and more than 1,000 impressions.
Industry averages vary more than you might expect, from 21.32% for animals and pet supplies to 28.79% for toys and games. Billo itself says to use your industry's number instead of the cross-industry average, and that its figures describe what happened in H1 2026, not a forecast.
The limits. This is one company's data from its own platform. A third-party summary of the same figures points out that Billo doesn't publish a margin of error or fully explain how each advertiser affects the averages, and that the data can't show whether a small gap is meaningful or whether a higher hook rate causes more sales. Treat the numbers as reference points, not pass-or-fail scores.
How much data is enough? There's no universal rule. As a rough statistical guide, with a true hook rate near 25%, random variation alone can move a measured rate by about ±2.7 percentage points at 1,000 impressions and about ±0.9 points at 10,000 (a simple binomial approximation; real ad delivery isn't random, so this understates the noise). So don't call a winner on a few hundred impressions, and don't read a 1-point gap on a small sample as a result.
How to read hook rate and hold rate together
The pair tells you where to look. This is a common practitioner reading, not Meta guidance.
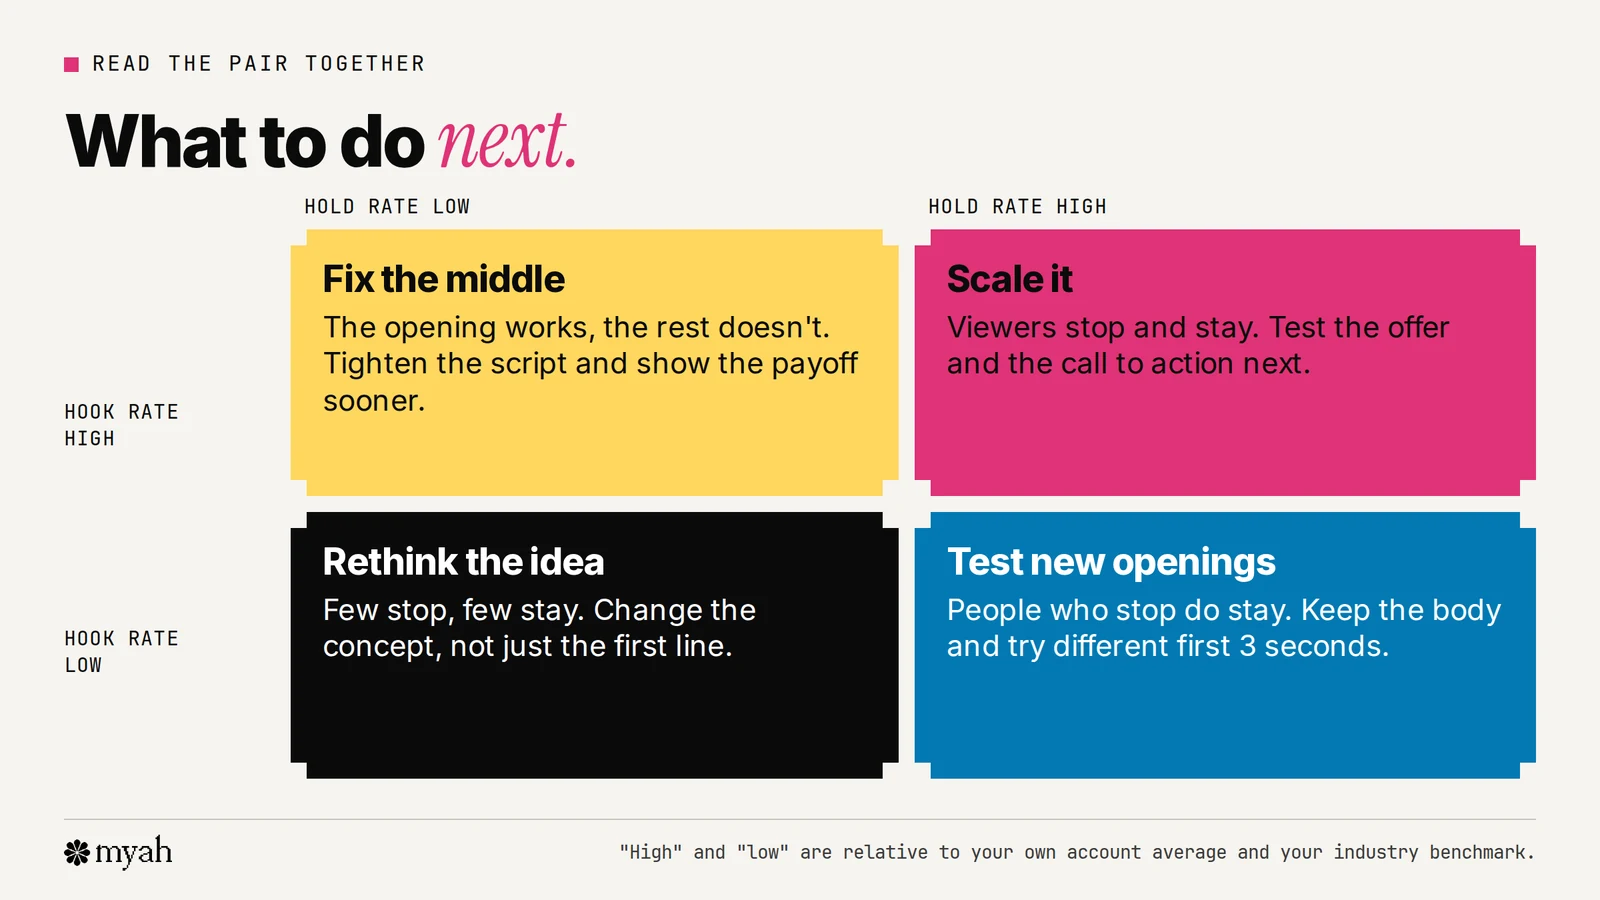
- High hook, low hold: fix the middle. The opening works but the rest doesn't. Tighten the script and show the payoff sooner.
- Low hook, high hold: test new openings. The people who stop do stay. Keep the body and try different first 3 seconds.
- High on both: scale it. Then test the offer and the call to action.
- Low on both: rethink the idea. Change the concept, not just the first line.
Where the leak is
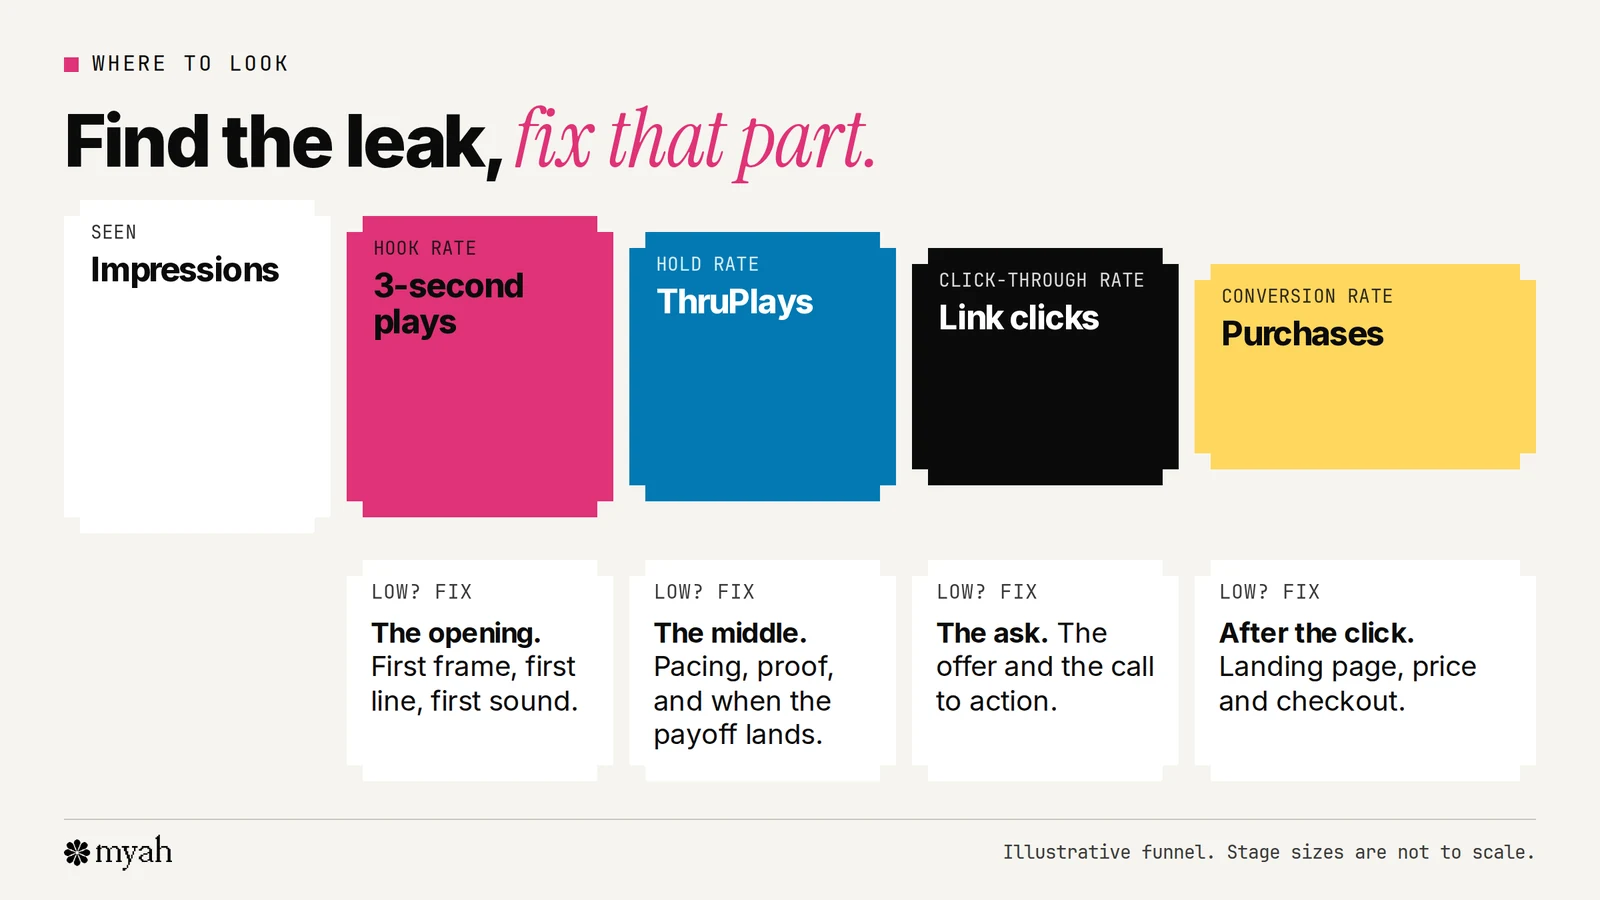
Hook rate covers only the first step. A strong one doesn't mean the ad sells. If people watch but don't click, look at the offer and the call to action. If they click but don't buy, look at the page after the click, the price and checkout. Attention is not the same as sales.
What the larger research says about testing
Hook rate is a diagnostic. The bigger lever, according to the largest public dataset we found, is how many ads you test.
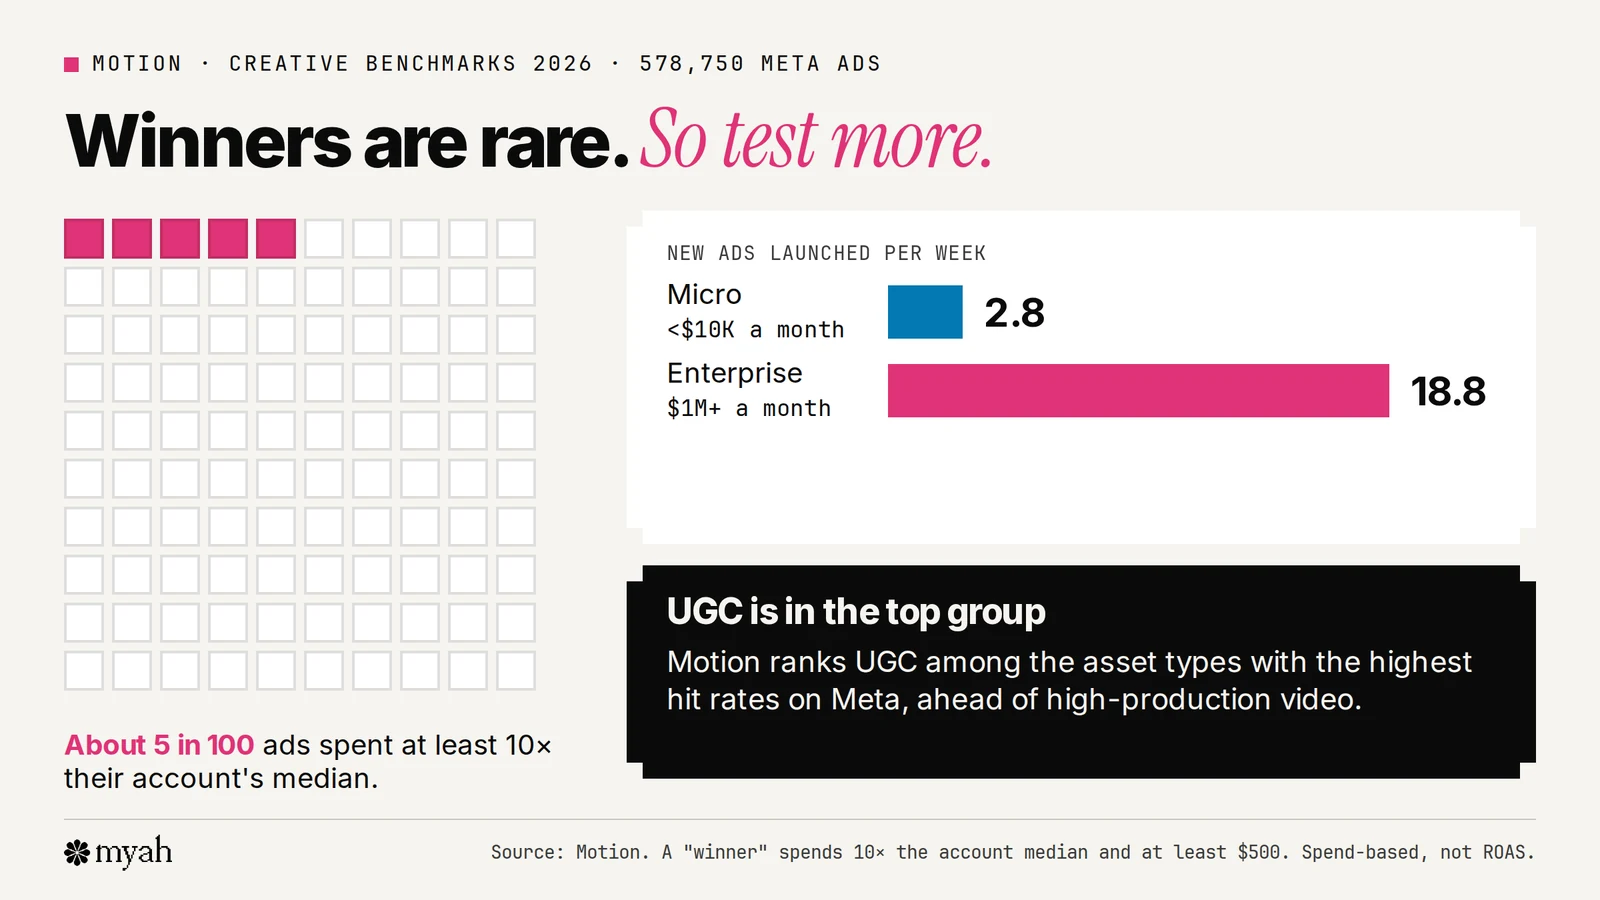
Motion's Creative Benchmarks 2026 analysed 578,750 creatives from 6,015 advertiser accounts and $1.29 billion of Meta ad spend between 1 September 2025 and 1 January 2026. It defines a winner as an ad that spends at least 10 times its account's median and at least $500. About 5% of creatives qualified.
Motion's volume finding is what stands out. Enterprise accounts (over $1 million a month) launched an average of 18.8 new creatives a week, against 2.8 for micro accounts (under $10,000 a month), a 6.7× gap. Hit rate rose with spend too, but modestly, about 2× between the smallest and largest tiers. Motion's conclusion: testing volume is the dominant variable.
Two cautions from Motion's methodology. First, "winner" means spend, not ROAS, so a winner is an ad Meta kept funding, not necessarily a profitable one. Second, the findings are associations, not causation.
On format, Motion's asset-type ranking puts UGC among the highest hit-rate asset types, behind text-only, product-image-with-text and lifestyle-product images and ahead of high-production video. Motion notes this varies by vertical.
What creators can do about the first 3 seconds
If you make the video, you don't control the ad account. Meta says creators see the same insights on a partnership ad as for their organic posts, while the business sees ad performance in Ads Manager. So ask the brand for hook rate and hold rate per video if they're willing to share. (Our guide to Meta partnership ads covers how the ad is set up.)
What you can control is the opening. Film the same video with two or three different first 3 seconds, and keep the demo, proof and call to action identical, so the brand can test the opening alone.
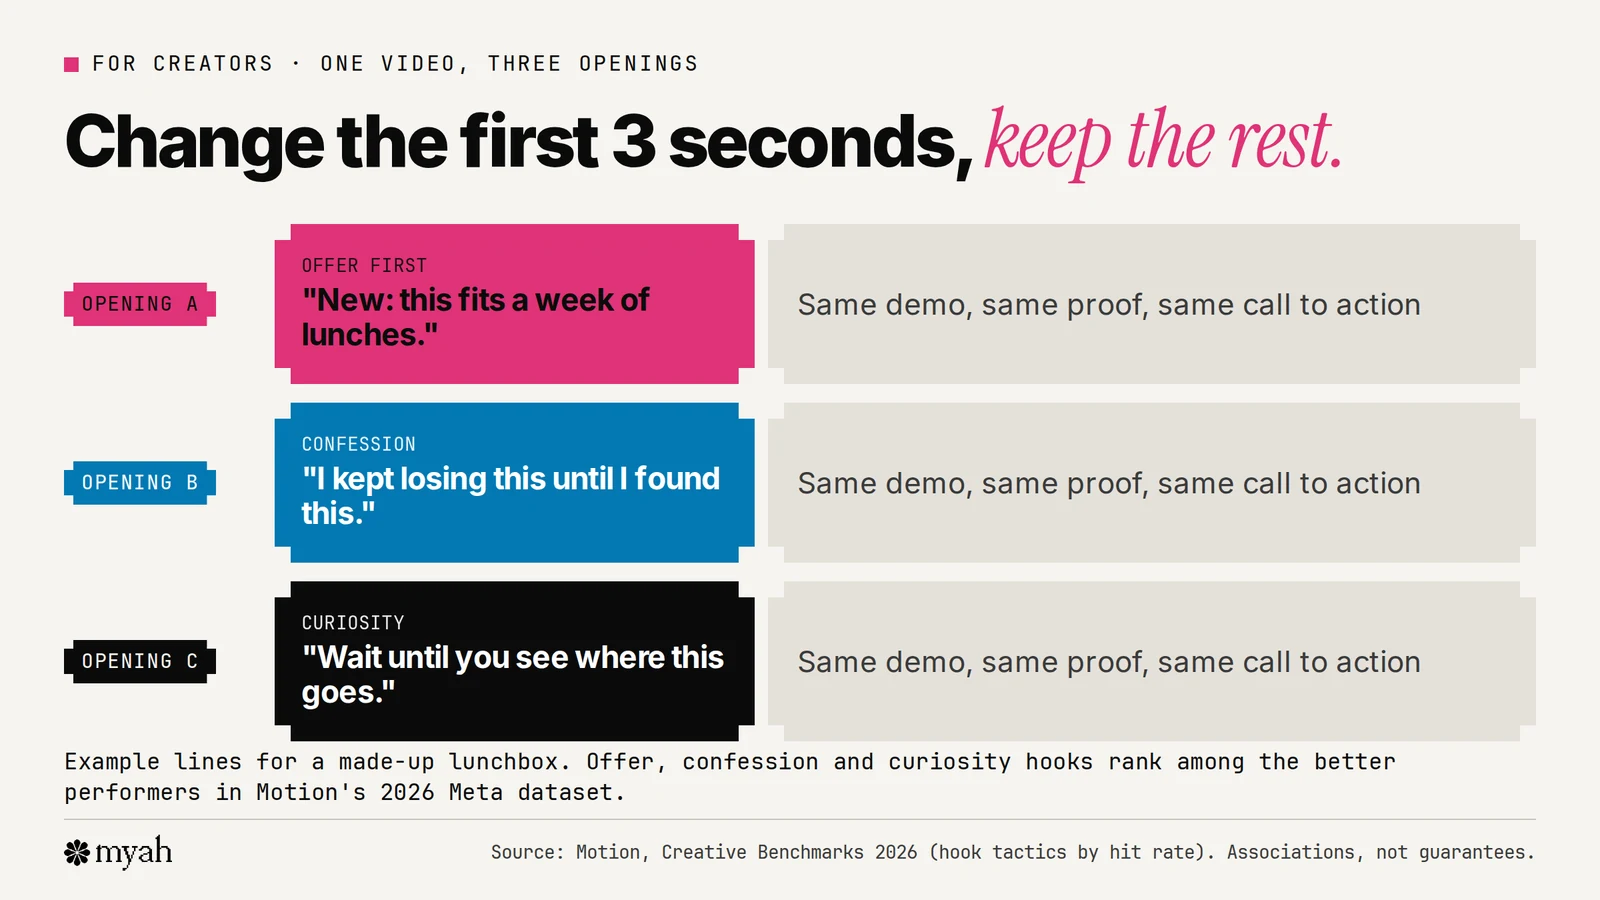
Motion's hook tactics ranking lists offer-only, confession and curiosity among the tactics with higher hit rates. Motion cautions that its data window (September 2025 to January 2026) included heavy holiday promotion, so promotional hooks are over-represented, and that the ranking isn't weighted by ROAS. Use it as a menu of ideas to test, not a formula. Extra openings are also a common add-on, so price them separately. Our UGC rate calculator uses $25 to $75 for each extra opening, and our rate-card example shows how to lay out the rest.
Practical tips that follow from Meta's own Reels guidance, which says to build in 9:16, use audio and keep creative inside the safe zones:
- Put the product or result in the first frame.
- Say the point out loud; don't rely on text alone.
- Keep text and logos inside the safe zone.
- Check how it looks with the sound off and on.
If you're briefing a creator, give them the opening you want to test, not just a script. Our UGC brief template has a section for it.
Free cheat sheet
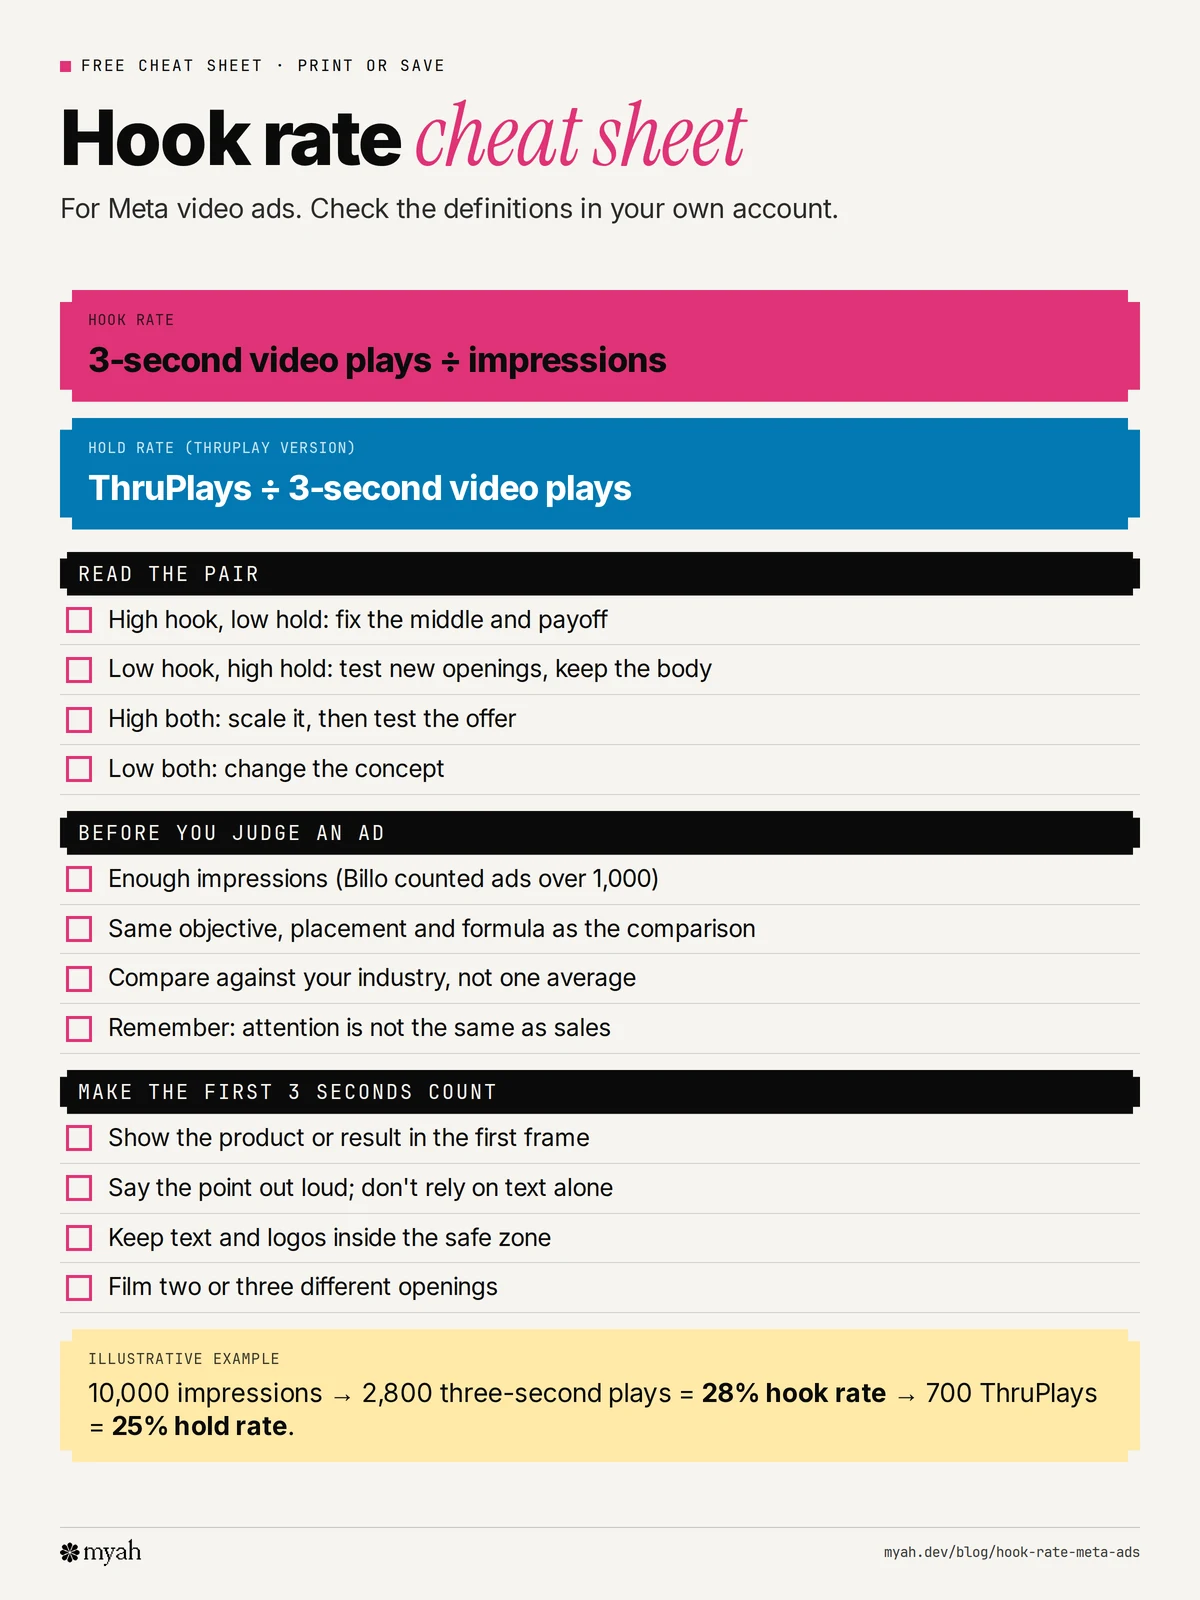
Print or save this one-page summary of the formulas, the way to read the pair and what to check before you judge an ad. Download the PDF.
Common questions
What is hook rate in Meta ads?
It's 3-second video plays divided by impressions, expressed as a percentage. It shows how many people who were shown a video ad stayed for at least 3 seconds. Meta doesn't report it by default; you create it as a custom metric.
What is a good hook rate?
There's no official benchmark. Billo's H1 2026 data shows an average of 25.44% across sales-objective Meta video ads, ranging from about 21% to 29% by industry. Compare against your own account and industry rather than a single number.
How do I calculate hook rate?
Divide 3-second video plays by impressions and multiply by 100. For example, 2,800 three-second plays on 10,000 impressions is a 28% hook rate.
What's the difference between hook rate and hold rate?
Hook rate is how many impressions reach 3 seconds. Hold rate, in its most common form, is how many of those 3-second plays go on to a ThruPlay (15 seconds, or completion for shorter videos). Definitions of hold rate vary, so write yours down.
Does a high hook rate mean the ad will sell?
No. It means the opening held attention. Sales also depend on the offer, the call to action, the page after the click and the audience. The benchmark data can't show that a higher hook rate causes more sales.
Can creators see hook rate?
Not directly. Meta says creators have the same insights on a partnership ad as on an organic post, while the business sees ad performance. Ask the brand to share the results.
Where to go next
Add hook rate and hold rate to your view, write down your definitions and compare each ad with your own account's average before you compare it with anyone else's. Then test more openings.
Myah is building a performance-UGC marketplace for brands and creators. Brands run approved videos as ads in their own Meta Ads Manager. Join brand early access or join creator early access for updates from Myah. Early access does not guarantee campaigns, availability or earnings.